


In today’s environment, user experience isn’t a plus. It’s a must.
Users are expecting that your website will be easy to navigate, and take them on a logical journey. They want it to be as friendly as possible and fulfill any needs they have.
Typically, however, businesses won’t report on the user experience beyond the bounce rate. They’ll simply look at the number of people who left their websites and perhaps why they left.
To succeed, you should be looking at much more than the bounce rate. It’s important to analyze on-site behavior to see what features work on the website and which ones bounce users away.
The following are five ways to track user experience in Google Analytics.
1. Button Tracking
The first thing you can look at when analyzing your user experience is button tracking. You’ll want to make sure that your tracking is 1-1.
The easiest way to manage button tracking is to distinctly name each button so it has it’s own tag in Google Analytics. You can organize your buttons however you want, in the end.
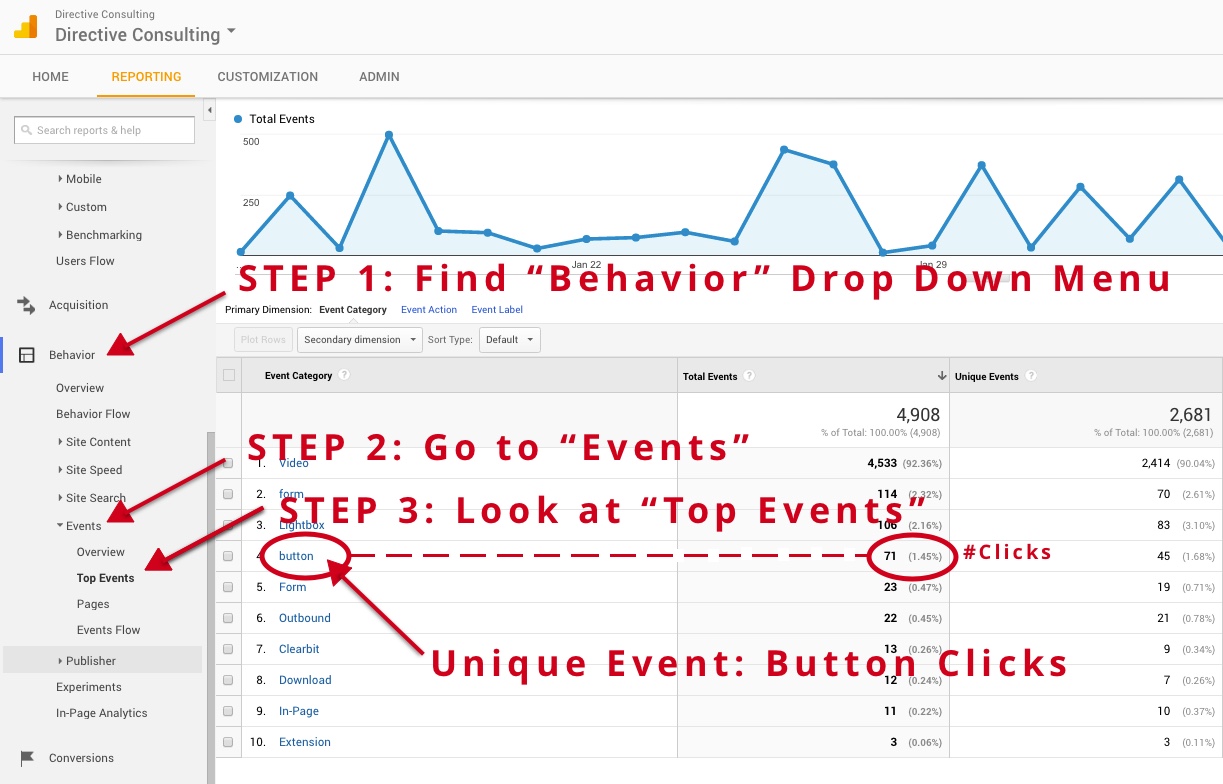
But you should at least segment your different conversions into different name types. This will allow you to at least contrast and compare how different buttons or conversions are performing.
You can also get super granular and track on how individual form submissions perform. This will have you making a lot of unique tags and pixels in GA. But, it should yield some really powerful insights.
For example, you may have both low level and high level form submissions on your site. If that’s the case, you can start to compare how different form submission fields are performing and see if users are stopping at a certain point within the individual form.
You may be asking for one to many data points and be bouncing away a large percentage of possible conversions. These are things optimizers need to know!
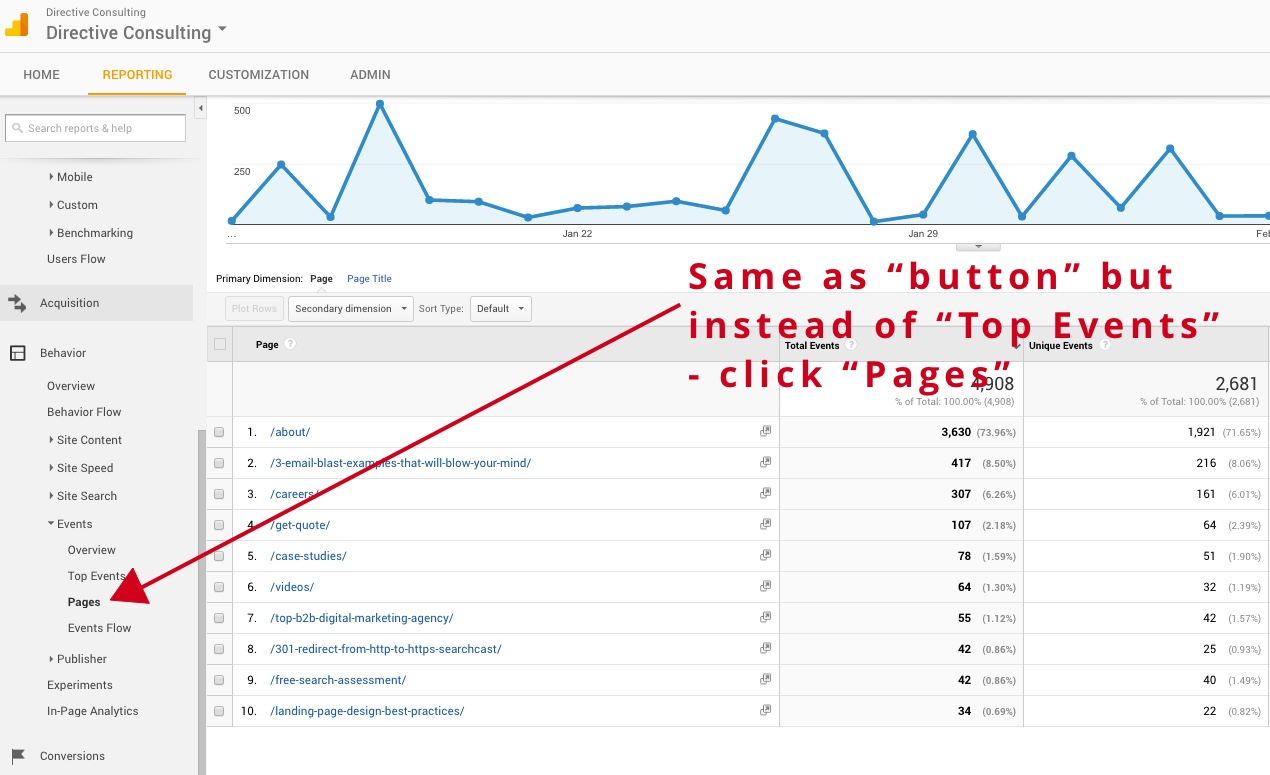
2. Destination URL Tracking
Next, track your destination pages where you want people to land so you can convert them.
A best practice for tracking and optimizing is to make dedicated landing/thank you pages for form submissions as well. These landing pages should be linked to a specific ad with a specific conversion goal and a singular CTA. Keep it streamlined and focused.
You also need to prioritize your “money pages,” which include:
- Service pages, such as get in contact form submissions.
- Product pages, which is where on-site purchases occur.
- Resource pages, where gated conversions happen and users enter your pipeline.
Tracking your money pages should also help you identify which channels are funneling the most valuable traffic to your site. You don’t want misdirected or unqualified traffic that reaches your service pages and bounces right off.
You’re looking for users that are looking for you!
3. Time On Page
Are users spending a few minutes on your page and then leaving, or are they browsing for a while? You might need to figure out why users are bouncing off the site as soon as they get there.
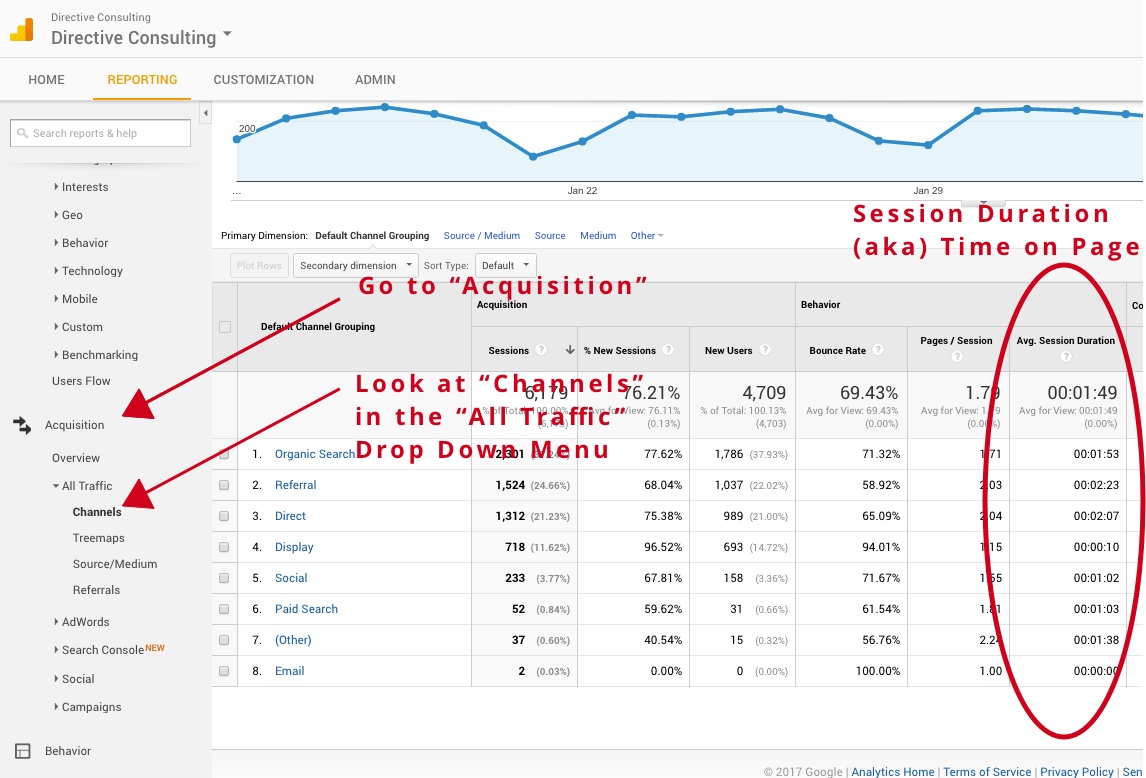
Track the time spent on your page by new users, repeat users, and visitors going to your blog posts. See if people who go to pages with content below the fold are making it to the end of the pages as well.
If you see that your blog posts aren’t being read the full way through, you have a few possible solutions.
- break the blog post in multiple, smaller posts that are more reader friendly
- turn the blog post into a gated content eBook that encourages more engagement after trading personal information to access it
- you can also repurpose the post into a series of videos to post on your site
Regardless of how you solve the problem of read percentage, you need to ensure that any necessary information users need to convert is above the read fold.
4. Behavior Flows
You’ll need to track the actual journey that users take when they visit your website. What pages do they click on? What links interest them? Where do they spend the most time? Do they convert on the first visit, or does it take a repeat visit to get them to purchase from you or take some sort of action?
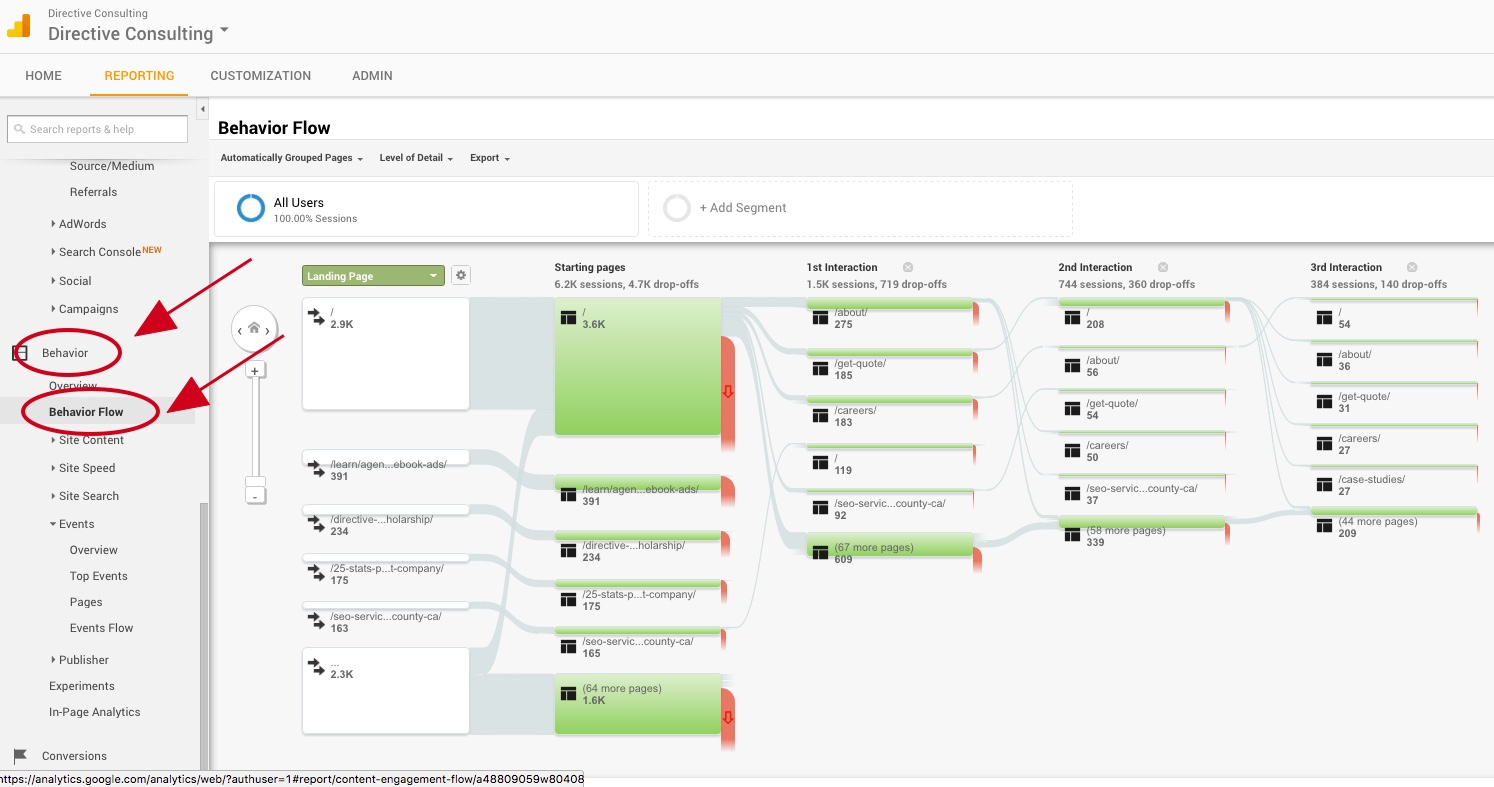
You should identify the high volume funnels through which your traffic is flowing.
It’s also crucial to combine behavior flows with the time spent on the page. You can do this by:
- Looking at how much time is spent on each page in a singular conversion path.
- Identifying which pages are “service” pages and which are “bridges.” Users won’t spend a lot of time on the pages that are bridges, but they’ll click through. Service pages may stop the flow of traffic with a conversion or long piece of content to read.
- Optimize towards your ideal conversion path. Make the user’s journey logical, easy, and always leading to a call-to-action that will help your bottom line.
5. Reverse Conversion Paths
Instead of looking at the conversion path starting from the beginning, do some reverse engineering.
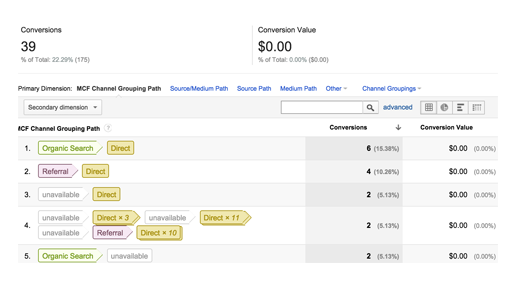
Here’s how to find your Reverse Conversion Paths in GA:
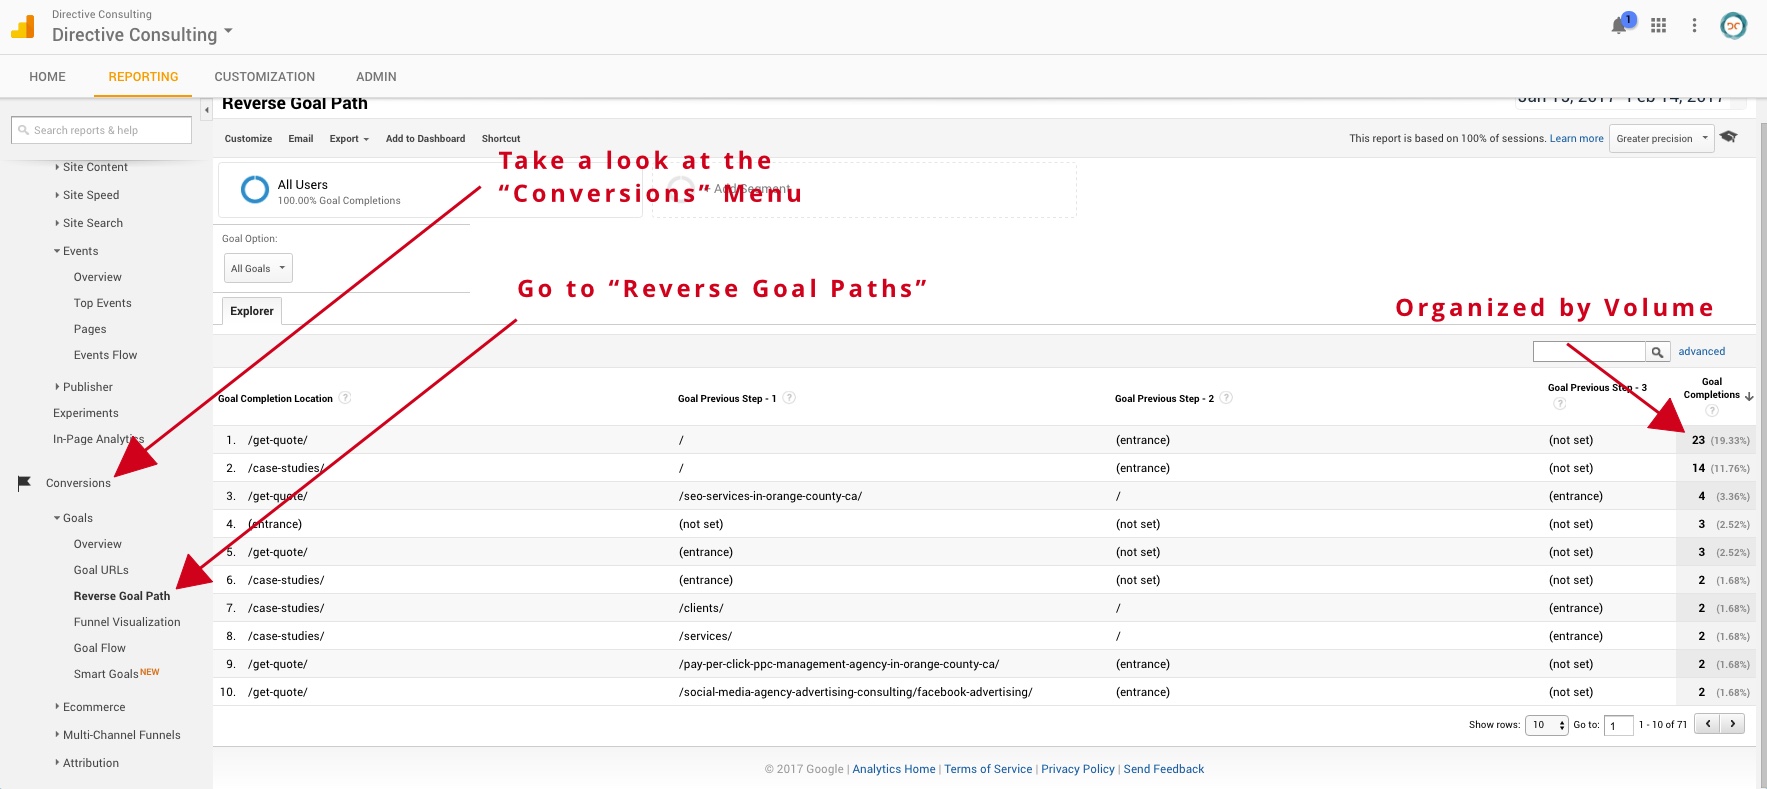
You can click through the highest volume reverse path to optimize towards your ideal customer journey.
This may actually be easier for you. Identify which paths lead to conversions and work backwards. Organize it by volume; start with the highest volume reverse path and then optimize the entire on-site experience towards the optimal conversion path.
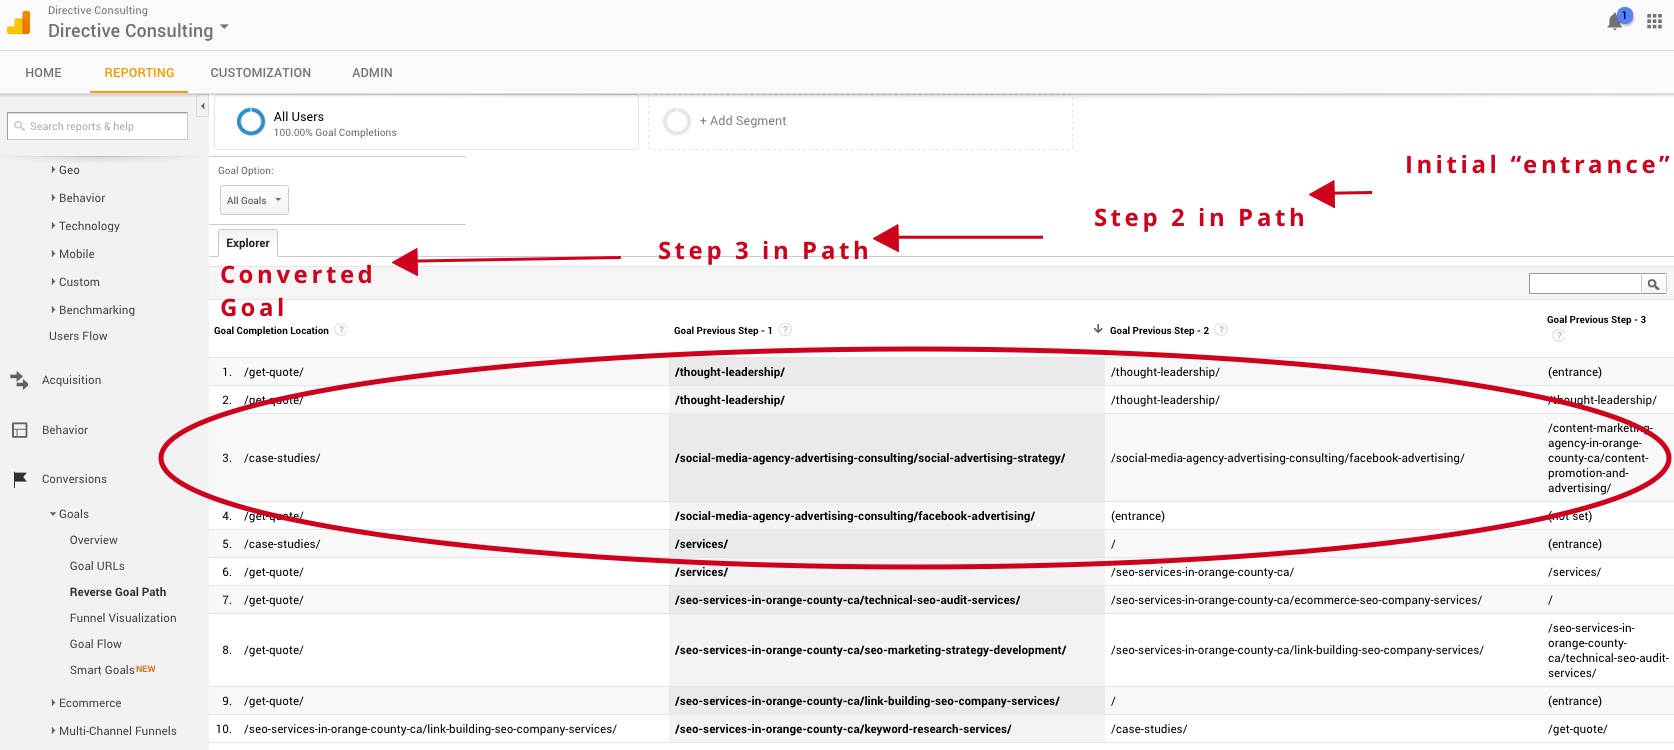
This should get your whole site working more like a sales funnel than it is a random assortment of pages. Not that your site is random – of course it isn’t you stud you
Key Takeaways
Tracking user experience can be confusing and frustrating, and Google Analytics won’t make it any easier for you.
But I want to make sure you walk away from this blog post with at least a bit better understanding of the monster that is GA. So, here are five tutorials, resources, and/or guides about setting up Google Analytics the right way:
Premium’s Guide to WordPress GA
Good luck, and happy reporting!